Adjusted R-Squared is a statistical metric used to evaluate the goodness-of-fit of a regression model while accounting for the complexity of the model. It modifies the traditional R-Squared value to include a penalty for adding more predictors, ensuring that the measure does not artificially increase simply by including additional variables.
Understanding Adjusted R-Squared
The traditional R-Squared quantifies the proportion of variance in the dependent variable that is explained by the independent variables in the model. However, R-Squared always increases or remains the same when new predictors are added, even if the new variables contribute little or no meaningful information to the model. This can lead to overfitting, where the model becomes overly complex without necessarily improving its predictive accuracy.
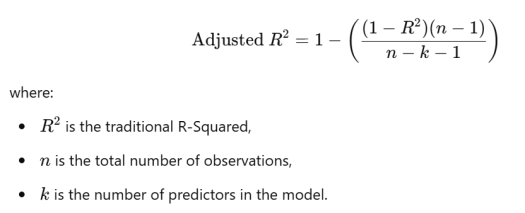
To address this, Adjusted R-Squared introduces a correction by considering the number of predictors relative to the number of observations. It is calculated as:

Key Features of Adjusted R-Squared
First, Penalty for Overfitting. Unlike R-Squared, Adjusted R-Squared decreases when irrelevant variables are added, discouraging overfitting.
Second, Comparison Across Models: It is particularly useful when comparing regression models with different numbers of predictors, as it provides a more balanced evaluation of model performance.
Third, Range. Like R-Squared, Adjusted R-Squared ranges from 0 to 1, where higher values indicate a better fit. However, it can sometimes be negative if the model performs worse than a simple mean-based prediction.
Practical Use Adjusted R-Squared
Adjusted R-Squared is a critical tool in model selection, helping researchers and analysts identify models that balance explanatory power with simplicity. It emphasizes the principle of parsimony, ensuring that models are not overly complex without justification, making it a reliable metric for evaluating regression models.

